I check the NameBio Daily Market Reports each day. However, it is also important to periodically look back on a weekly or monthly basis. The reason is because a number of domain names get added to the database not within the 24 hour period after the sales date and therefore they never appear in any Daily Market Report.
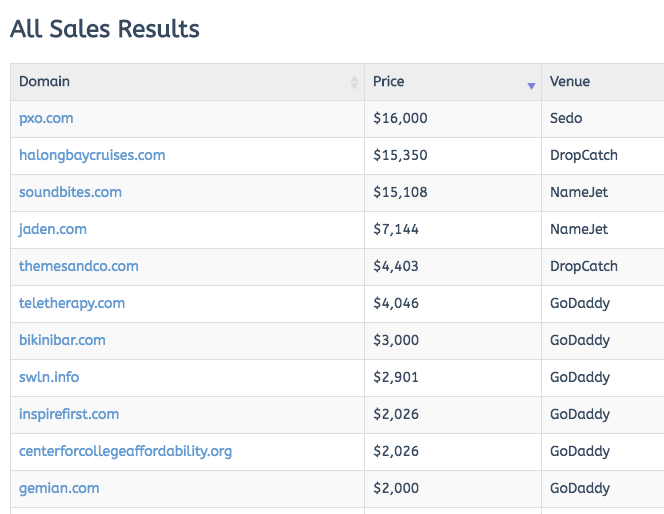
Let’s take a specific example from the past week. The Daily Market Report for Nov 4, 2018 showed 226 sales, the largest being PXO.com that sold for $16,000. The total sales volume was just over $156,000, and the average price $691. The top 10 sales from the Daily Market Report are shown in the figure.

However, if a few days later we do a NameBio database search for domain sales from that date, Nov 4, 2018 we now have 249 sales. That is not remarkable, as a number of reports come from venues that don’t report to NameBio within the short time frame needed to get into that day’s daily market report.
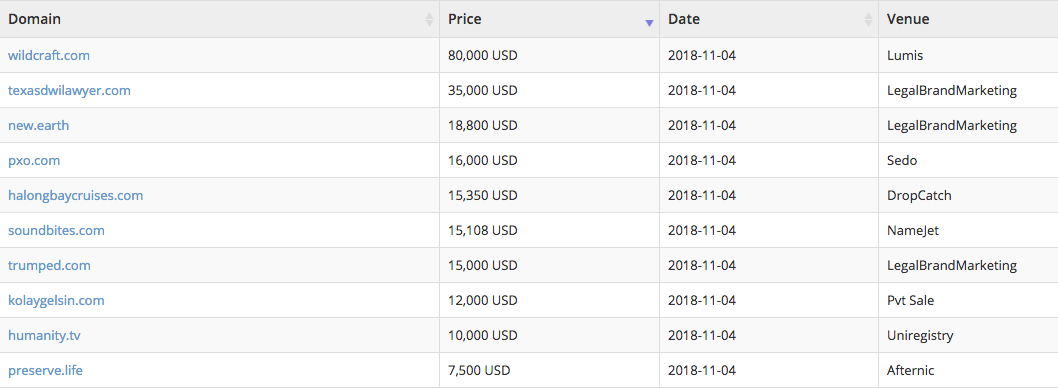
Now you might think this is not that significant, after all only about 10% more sales were added. However let’s look a little deeper. I show below the revised list of leading sales for the day and we see that there are major differences. In the updated list the top sale is $80,000 and the sale that was in first place in the daily report has now dropped to fourth place. The sales volume has more than doubled to just over $381,000, and the average price has also more than doubled, now sitting at $1531.

The sales volume has more than doubled, and the value of the top sale changed by a factor of 5, when we include the late additions for the day.
This is of course a single day and the differences are by no means always this dramatic. However, I think it is likely that there are systematic biases associated with which sales are more likely to not make the daily report. The sales from places like GoDaddy, Sedo, Flippa, etc. are automatically reported to NameBio and therefore make it into the daily report. Sales from brokers and private or company sales are less likely to be reported in time. Often these are high value retail sales, so, as we saw in this example, the top of the sales chart changed significantly.
It is likely that there are systematic biases associated with which domain name sales are more likely to not make the daily report.
Sales from the Asian venues are less likely to make the daily report both because of time zone and reporting differences. I have not done a careful analysis but it seems that new domain extension sales more often miss the daily report because of the venues where they most often sell. On this particular date the Daily Market Report showed zero new extensions. However, a few days later there were 9 new extension sales for the day, including 2 in the top 10 places and 4 in the top 20 places. The sale of new.earth took third place in the updated report for the day.
On this day the Daily Market Report showed zero new extensions. However, a few days later there were 9 new extension sales for the day, including 2 in the top 10 places and 4 in the top 20 places
TIP: As well as looking at the daily NameBio reports, once a month look at the past month as it will show a number of sales that were not in any daily report. It is important to have an accurate and full picture of what is really selling.
Fortunately the last week and last month settings on the NameBio interface makes weekly and monthly searches easy to do. As a domain investor you might want to set a certain day each month in your calendar to regularly do this.


[…] Don’t Only Rely On Daily Market Reports… Wait What? […]
“As well as looking at the daily NameBio reports, once a month look at the past month as it will show a number of sales that were not in any daily report.”
Great advice Bob, but it can also be very useful to look at much longer time frames like quarterly or annually.
I also invest in shares so I often try to find comparisons with domaining to improve strategies. So the following sharemarket quote about market trends seems relevant:
“Robert Rhea, one of the market’s first technical analysts, labeled these trends as tides (long-term trends), waves (intermediate-term trends) and ripples (short-term trends). Trading in the direction of the market tide is generally the best strategy. Waves offer opportunities to get in or out of trades, and ripples should usually be ignored…”
https://www.investopedia(DOT)com/articles/trading/03/042303(DOT)asp
So if a comparison is valid, a daily domain report is a “ripple” and an experienced investor can’t learn too much. But if you look at weekly or monthly reports (“waves”) or quarterly or annual reports (“tides”) then you may be able to spot important long term trends.
Every now and then I go back and look at a DNjournal sales report from 5 or even 10 years ago, and that seems to help you to guess what might happen 5 or 10 years into the future.
Thank you for the excellent insights, Dave. I totally agree that an annual analysis is a must. I wish that NameBio made it easier to do a quarterly analysis since see great virtue in that. The idea to look way back at DNJournal is not something I have done, but an interesting idea I plan to try – maybe even I will write about the experience! Thanks again for your valuable comments.
[…] the daily reports I kept the information as reflected in that daily report. Some sales are added to the database after the deadline and therefore do not […]
[…] do a full NameBio search, as a number of sales are reported long after the date of sale. As we discussed here, these can distort your impression of the sales […]
[…] In the daily reports I kept the information as reflected in that daily report. Some sales are added to the database after the deadline and therefore do not appear. This was a relatively slow week in new domain extension sales, but often these appear in the NameBio database too late to make the daily reports. […]