
While some domain names obviously sell to businesses rebranding or upgrading, much of the demand for domain names comes from startup businesses. It is therefore useful to know what sectors are growing strongly.
The US Census Bureau provides a wealth of such data, updated monthly. The data shows that the response to the pandemic has varied strongly across sectors. Let’s have a look.
The US Census Interactive Graph Tool
You can find the most recent data by going to the United States Census Bureau Interactive Graph tool. Then click on Monthly Interactive Visualizations. It shows the number of new business applications per month, seasonally adjusted.
A pull down menu allows you to choose the Total or by Industry.
Data is updated monthly.
Overall Business Starts
Let’s first look at the rate for all business applications combined.
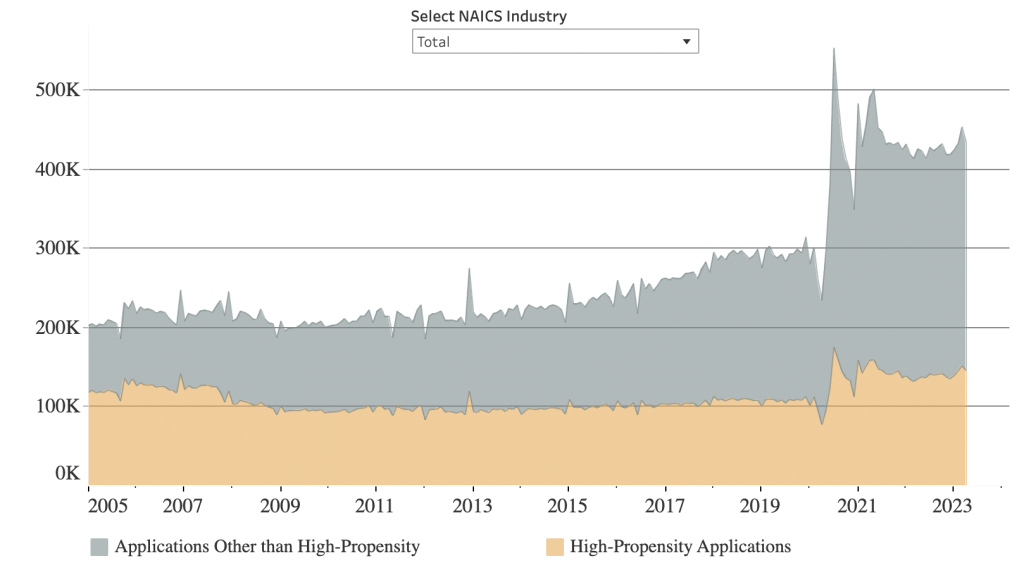
US Census Bureau data for Total Monthly Business Applications from the Monthly Interactive Visualizations.
You can clearly see the impact of the pandemic, first a sharp drop in new business applications, followed by a huge increase.
Note that while there has been some decline since the 2021 peak, we are still well above the trend from prior to the pandemic.
The US Census data shows separately high-propensity applications, in orange. These are businesses with a payroll, while the graph in gray indicates applications from much smaller, often single-person businesses. Most of the increase over normal since the start of the pandemic has been in very small businesses. This has implications for the price range of domains these clients are likely to acquire in the aftermarket.
Finance and Insurance
But when one looks at individual sectors, the pattern of business applications is significantly different. For example, the Finance and Insurance data below indicates almost no change in high-propensity business applications, with some increase in smaller businesses, followed by a steady decline until very recently.
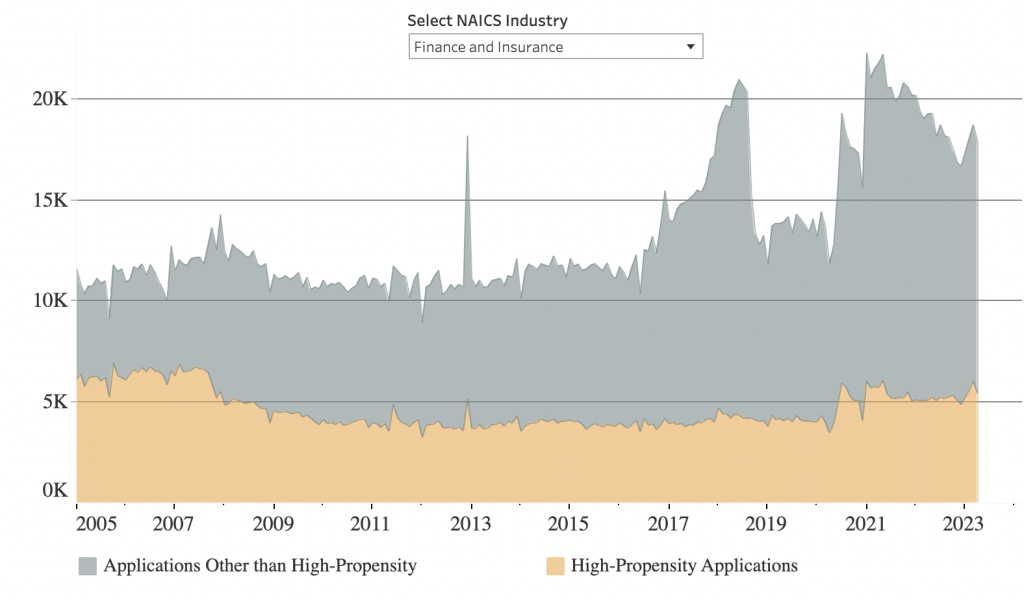
US Census Bureau data for Finance and Insurance Monthly Business Applications from the Monthly Interactive Visualizations.
Educational Services
The pandemic brought about a surge in online training, while conventional in-person training and classes struggled for a period. Here is how new US business applications in that sector varied.
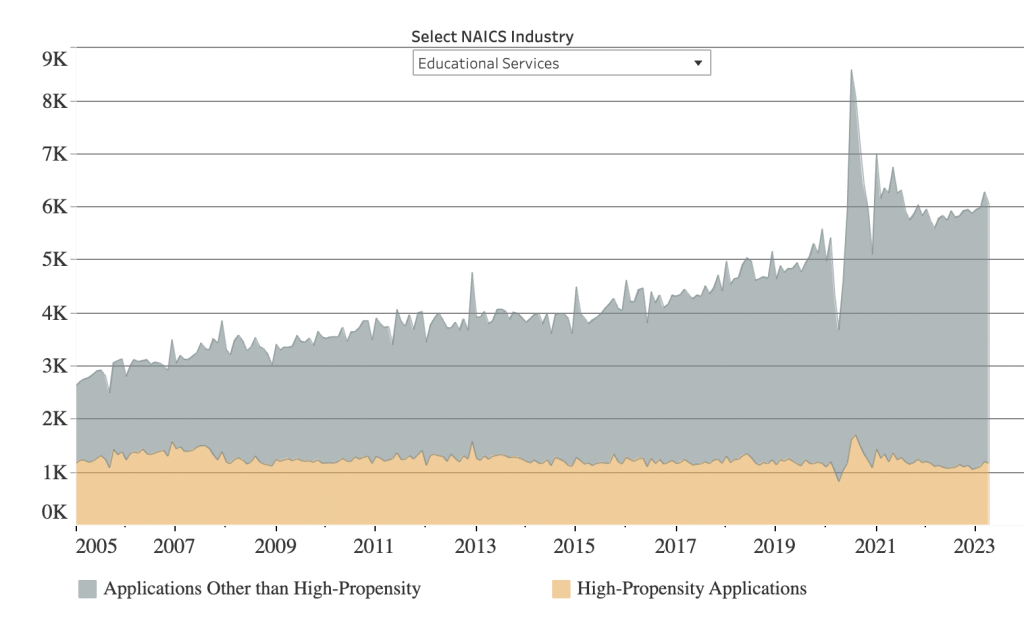
US Census Bureau data for Educational Services Monthly Business Applications from the Monthly Interactive Visualizations.
For this sector, after the spikes near the beginning of the pandemic, we are approximately where the long-term trend line would have predicted.
Retail Trade
Many stores converted to do more business online, or in some cases became online-only retail outlets. The monthly graph for Retail Trade shows this clearly, although note that after the surge early in the pandemic that sector has been steadily declining, in terms of number of new applications per month. Soon it will be at the long-term trend value if this continues.
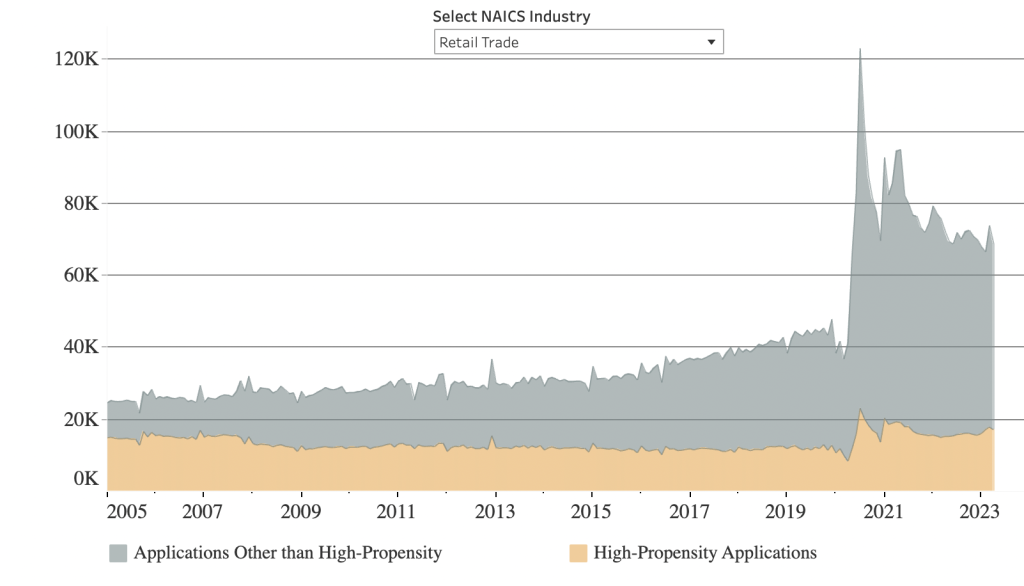
US Census Bureau data for Retail Trade Monthly Business Applications from the Monthly Interactive Visualizations.
You can readily search other sectors using the interactive viewer. While restricted to the United States, this data can help inform domain investing, to identify sectors with surges in new business applications.
The sectors covered in the US Census business application data are:
- Accommodation and Food Services
- Administrative and Support
- Agriculture
- Arts and Entertainment
- Construction
- Educational Services
- Finance and Insurance
- Health Care and Social Assistance
- Information
- Management of Companies
- Manufacturing
- Mining
- Other Services
- Professional Services
- Real Estate
- Retail Trade
- Transportation and Warehousing
- Utilities
- Wholesale Trade